

AI-SEO
The Methodology Behind Visibility in AI Assistants: From Foundations to Results
How the models select sources, what AI crawlers can and cannot read, and how to measure your ranking in AI responses. Once you’ve read this, you’ll know why you’re mentioned or omitted, what to fix first, and when you can tell if it’s working.
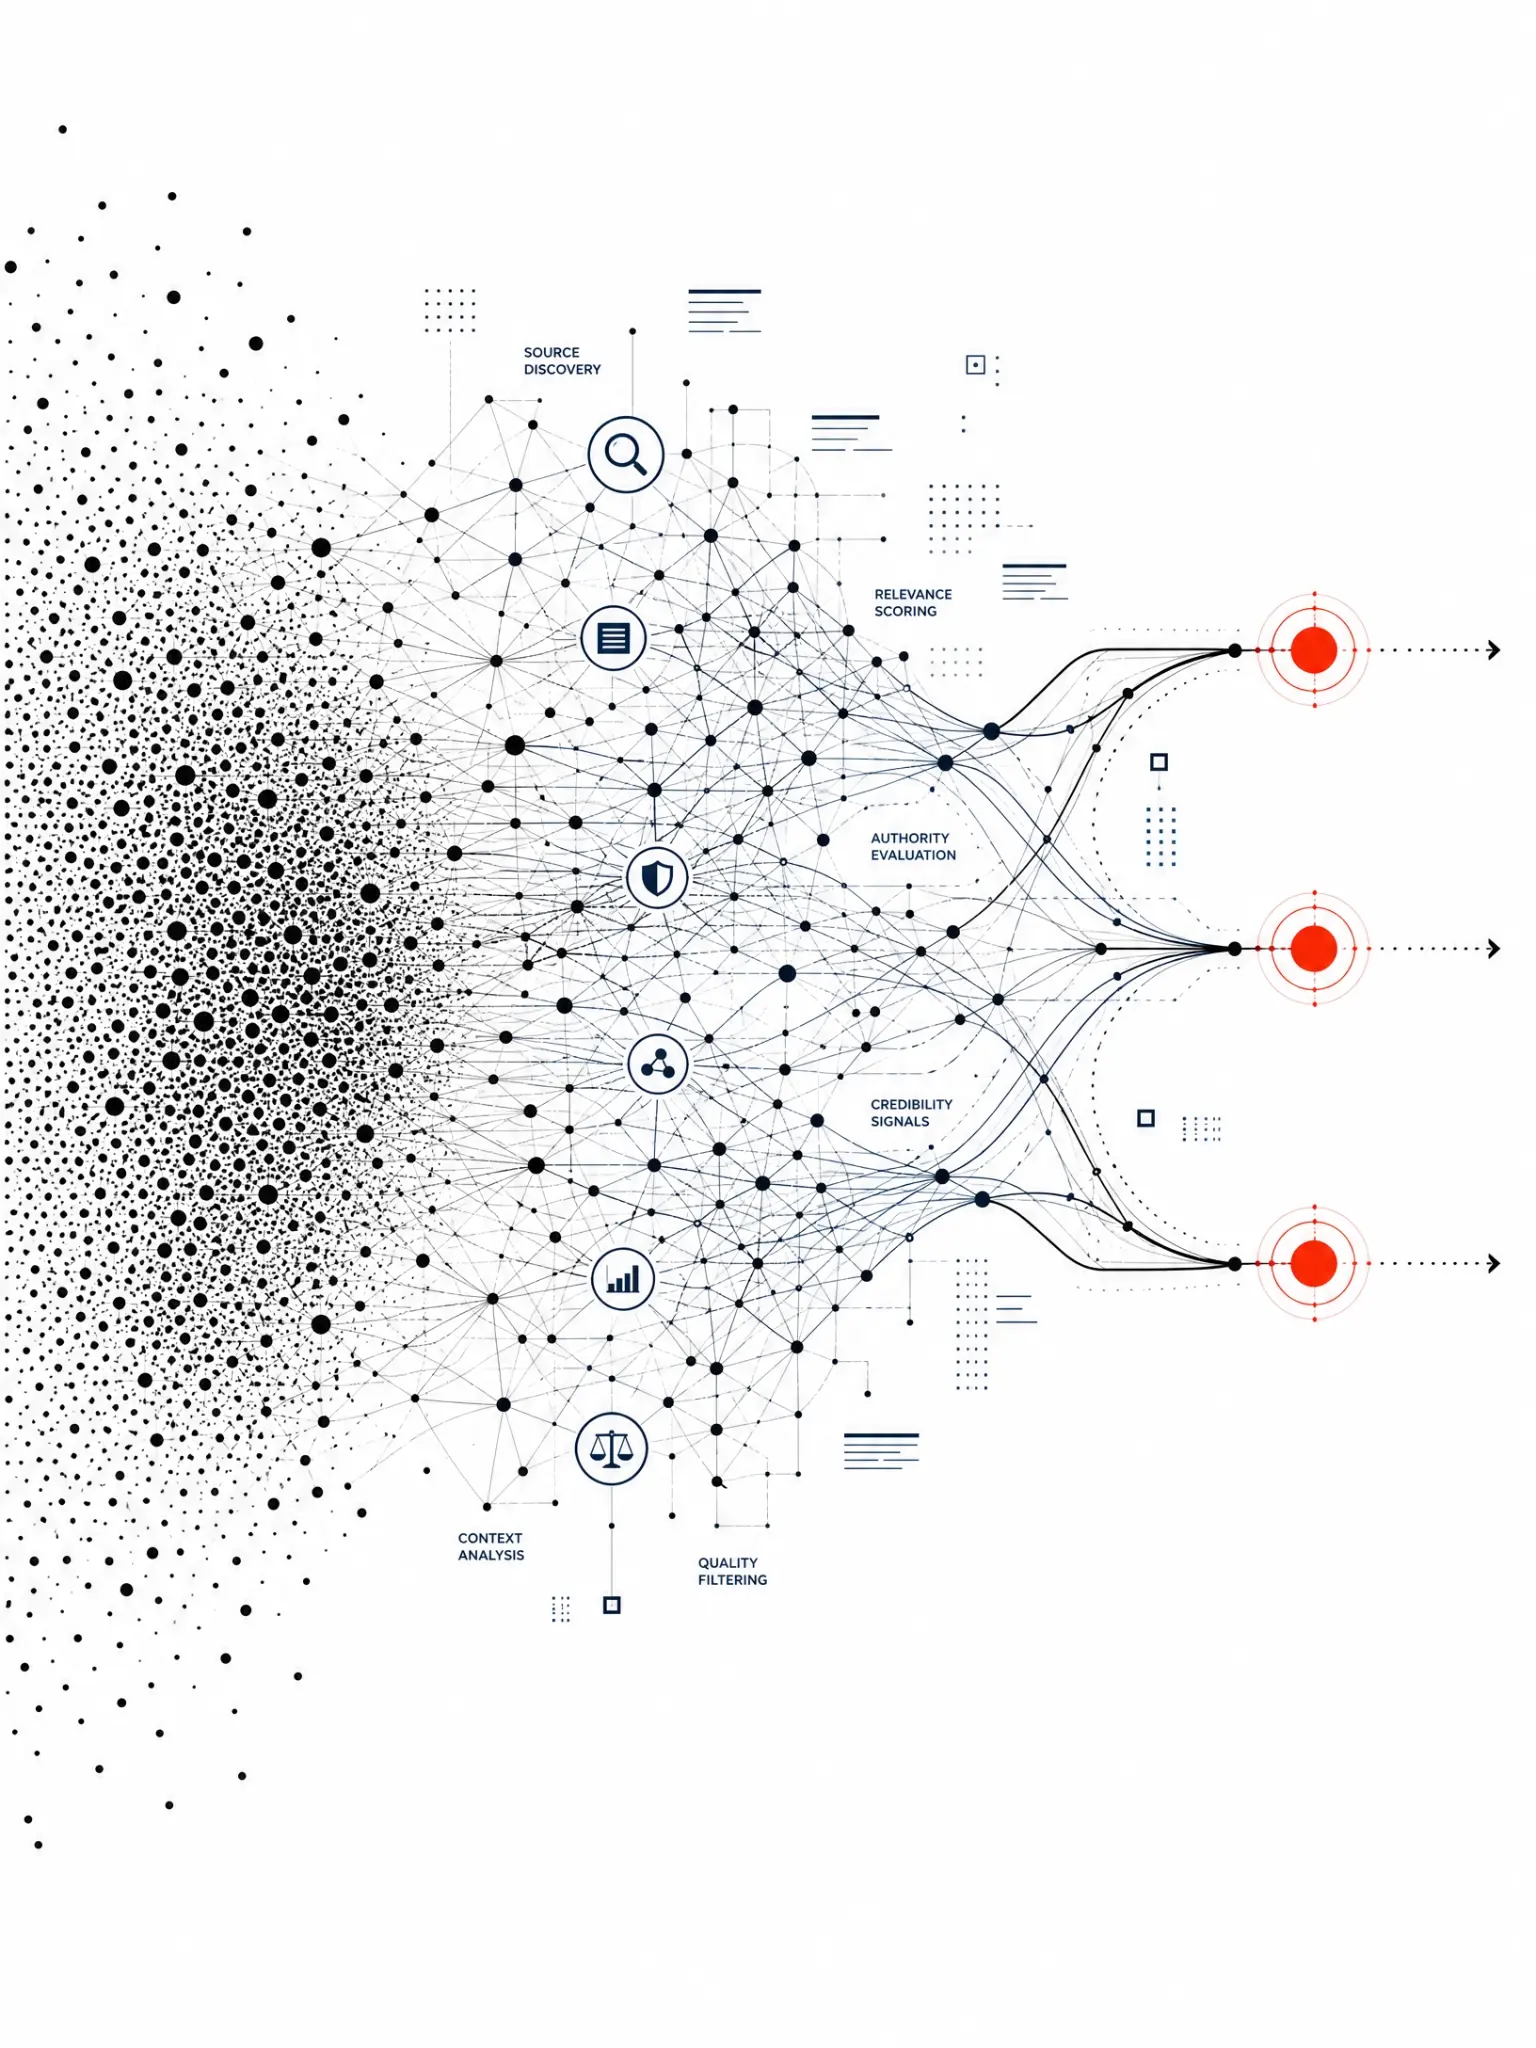
The decision has been shifted from Google to an AI conversation
Your potential customers are increasingly making some of their decisions during a conversation with an AI assistant. They do this before visiting your website or speaking with your salespeople.
94% of B2B buyers use language models to summarize reviews or analyze data during the purchasing process. In Europe, the figure is 89%, and in Sweden, 86% (6sense, November 2025).
68% of Google searches in the U.S. end without a click, up from 60% in 2024 (SparkToro/Similarweb, 2026). When an answer narrows down an entire category to three to five names, that’s where the field gets narrowed down.
The consequences can be costly. In 95% of cases, the buyer purchases from one of the suppliers that was on the shortlist from day one (6sense, November 2025).
If the list of suppliers is generated by an AI response and you are not mentioned, you will be filtered out before anyone has evaluated your company.
The basis is the same as before. Google itself confirmed this in its documentation on May 15, 2026:
”Optimization for generative features is SEO. There is no separate technical approach, no AI-specific markup, and no requirement to break content down into small pieces.”
What's new is that the answer has room for only a few names, and that the order no longer determines who is mentioned. On top of the foundation are five layers:
That is the order the rest of the document follows, and the fifth layer has been given its own section, because that is where most initiatives are measured incorrectly or not at all.
Four Numbers—and What They Don't Cover
The shift is clear. The four figures below are the ones most often cited regarding AI and search, and they’re worth knowing—precisely because they’re presented to you. Two of them are from the U.S., one relates to retail, and none of them are based on Danish B2B data. That’s why there are three sections that follow: The first two distinguish what the figures can and cannot tell us, and the third compares the Danish and Nordic context, because that’s what matters to you.
The search result is more often the destination than the path to it. This is the trend the industry calls “zero-click.” For you, this means that the part of the customer journey you can track in analytics is shrinking, while the part that determines the outcome is moving to a place where no web analytics tools can reach. Denmark is also the EU country where generative AI is used the most. This shift is therefore affecting Danish companies before it affects their European competitors, and this applies both ways: both the loss of clicks and the opportunity to be the name the assistant mentions.
AI-referred traffic to U.S. retail pages has grown more than 14-fold since October 2024, and it converts 54% better than traffic from other sources (Adobe Analytics, 2026). The explanation is likely selection bias rather than an effect of AI: Users who click through from an AI response have already had their questions answered and their list of candidates narrowed down, and are therefore further along in the decision-making process than a random searcher.
The four figures above show the trend. The figures here show the level of the market you're selling in, and they paint the same picture: Denmark is ahead of the curve, not behind.
86% of Swedish B2B buyers use language models when researching solutions. The European average is 89%, and the global average is 94% (6sense, November 2025). Sweden is the only Nordic country included in the survey, and its figure is close to the European average.
Denmark ranks first in the EU in terms of companies' use of AI. 42% of Danish companies with at least ten employees use at least one AI technology, compared with an EU average of around 25% (Eurostat, 2025).
27% of Danes use AI in connection with work, up from 21% the previous year. Among 25- to 44-year-olds, just under half do so (Statistics Denmark, March 2026, approximately 18,000 interviews).
The assistant has moved to the first filter
Between the first interaction and the purchase lies the phase that Google calls ”the messy middle,” where the buyer researches, compares, and changes their mind. That’s where the assistant has positioned itself as the customer’s first—and sometimes last—filter. Google’s AI Mode surpassed 1 billion monthly users one year after its launch, and Google itself describes this direction as the gateway to ”the era of Search agents” (Google I/O, May 2026). ChatGPT’s app is at the same level, with 1 billion monthly users. These two figures shouldn’t be added together to make two billion, as many people use both, and neither provider discloses the extent of the overlap.
In 2025, Semrush projected that, starting in early 2028, AI search could drive more visitors to websites than traditional search. There is a caveat, and it’s a significant one: The projection is based on over 500 topics within digital marketing and SEO—that is, Semrush’s own industry, where users are more advanced than in any other field. Semrush assumes that the pattern would apply more broadly, but does not measure it. We don’t count on that date. The industry’s track record with these kinds of projections is poor, and a specific year like 2028 isn’t something you can base a budget on. The trend, however, is not up for debate, and you can measure it against your own numbers tomorrow.
But the objection we hear most often is: ”AI accounts for less than 3% of our traffic, so why spend time on it?” It’s counting the wrong thing. The value lies in the mention, not in the click. When an AI answer appears in Google, users click through to an organic link in 8% of visits, compared to 15% when there is no AI answer, and they click on the link within the answer itself in 1% (Pew Research Center, July 2025, U.S.). The decision is made within the answer, after which the customer either Googles the company name or goes directly to the website and appears in your analytics as brand or direct traffic.
What you should check is whether your brand or product searches are increasing in Search Console at the same time that direct traffic is rising. If this happens without you having ramped up your campaigns, mentions in AI responses are the most likely explanation. This is an indirect metric rather than definitive proof, but it’s based on data you already have access to, and it costs nothing to check. The other knock-on effects are discussed in Section 11.
There’s also a structural argument to consider. Cloudflare has calculated what the AI crawlers are actually used for, based on a 12-month period on their own network: 80% went toward training, 18% toward search, and 2% toward specific user actions. Only the middle category can result in a source reference with a link. The rest goes toward training and the responses the assistant provides in the chat, where the user never leaves the window. And in June 2026, Cloudflare’s CEO reported that automated traffic had surpassed 57.5% of their total traffic. The system is built to read your input and respond on your behalf. The click is a byproduct. For your reporting purposes, this means that a page can do its job without ever receiving a visit, and that the value of a page can therefore no longer be determined by its traffic alone.
Stimulus → Google ⇄ website ⇄ research ⇄ comparison → action
The customer navigates back and forth between search results, pages, and comparisons—often many times—before the picture is clear enough to make a purchase.
Trigger → conversation with the assistant → possible Google search → website → action
The assistant handles a large part of the research and comparison and provides a narrowed-down list of three to five names.
In the second pass, the assistant combines several of the links. And the models are based on the companies that currently dominate their sources, so the longer a competitor has held that position, the more work it takes to take its place.
The assistant typically mentions three to eight companies or websites. If you’re not among them, you won’t be on the buyer’s shortlist from day one. And it is precisely that list that accounts for 95% of the orders won, while the favorite before the first sales contact wins 77% of them (6sense, November 2025, nearly 4,000 B2B buyers in North America, Europe, and Asia). Incidentally, the supplier the buyer contacts first wins about 80% of the time, and the order of contacts is often determined by who was mentioned. AI visibility won’t win the deal for you. It determines whether you’re on the list when it’s drawn up.
From Invisible to the Top 2 on ”Interim CFO”
Ask ChatGPT or Google’s AI Overviews who can provide an interim CFO, and Azets ranks number 1 or 2. That’s how it looked when we checked in August 2026. A year ago, they were nowhere to be found: They were just one of many that no model knew well enough to mention.
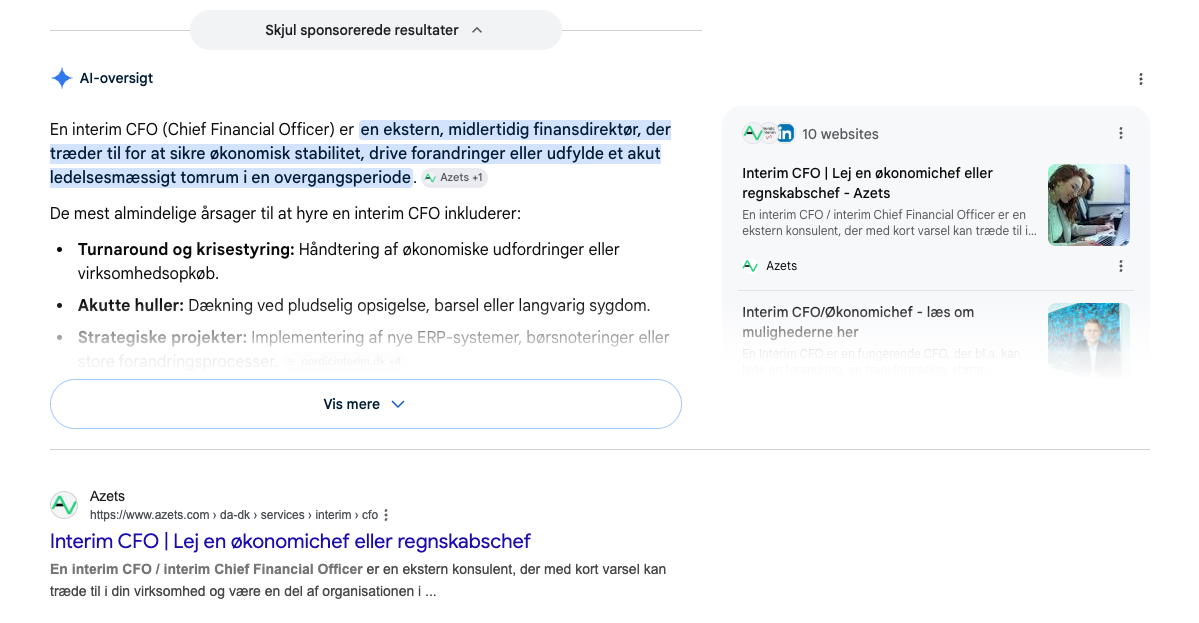
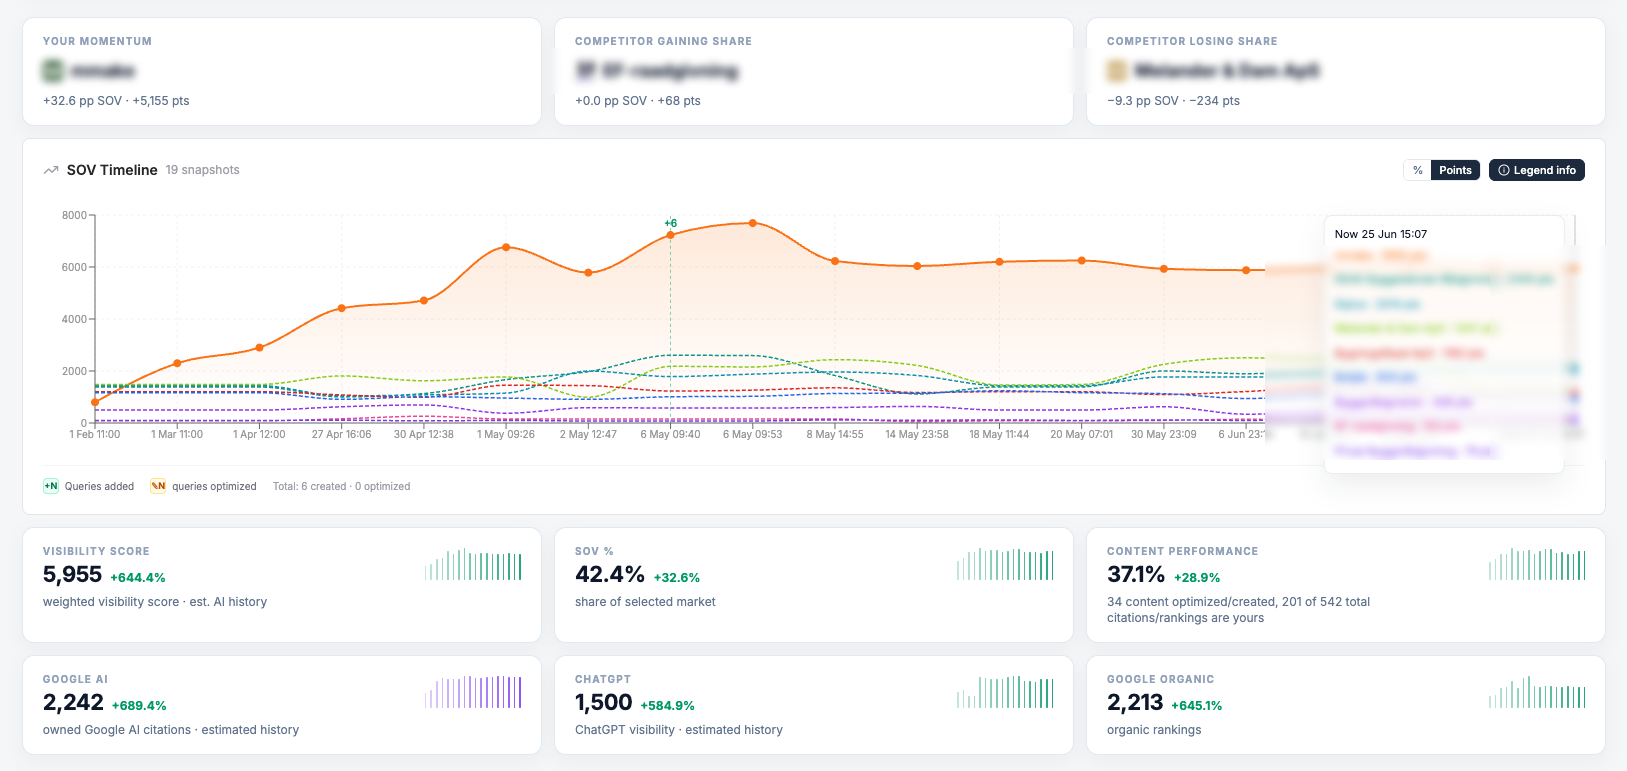
Azets currently leads the category by the widest margin. The second-place contender has 18.8% in reviews, and the third-place contender has 14.2%, so the lead is real, but it is not insurmountable, and it must be maintained.
A share of mentions is a means, not an end. The value for Azets lies in the fact that this visibility has led to inquiries from customers who weren’t familiar with them before.
Here's how it was done
The work focused on three of the five layers from Section 09. The key point here is which ones were worked on and which ones were not needed.
A total of 27 business-critical prompts were identified in this category. They came from Search Console, Google Ads data, and a review of competitors.
Over 20 pages were optimized so that each priority issue had a page that could be cited.
22 articles citing Azets, published in media outlets, blogs, and websites relevant to the category.
A baseline before the first correction, followed by an ongoing tally for each assistant using the method described in Section 11.
The entity, on the other hand, didn’t add much. Azets is a large, well-established brand, so the models’ picture of the company was already fairly accurate. It’s worth keeping this in mind when reading the figures in Section 09 on brand strength: The starting point determined where the work needed to be focused, and this is where the gap lay—in the questions and in the authority, not in the entity itself.
Time Horizon: The first measurable results appeared within three months.
AI visibility is measured in the ”Interim CFO” category using the method described in Section 11: Multiple runs per prompt per assistant, compared to a baseline from before the work began—never based on a single response. Conversions and organic traffic were extracted from GA4 and Search Console and compared to the same period the previous year.
The layers ran in parallel, so we cannot isolate the contribution of each individual layer; we can only describe the order in which they were launched. The period also includes Azet’s own campaigns and market conditions. The project began as a Danish pilot and is now a global program.
”We’ve never seen such a massive increase in traffic and qualified inquiries.”
Get an AI SEO Audit
A no-obligation audit shows how visible you are in AI responses today, which sources the models draw from in your category, and what’s preventing you from being mentioned.
Request an AI SEO AuditThe technical foundation is still the key to success
A technically sound structure, high-quality, unique, and helpful content, and a highly diverse backlink profile are still the prerequisites for everything that follows. It’s the payoff that has changed. A top ranking on Google yields one link out of ten. An AI response mentions three to eight companies and leaves out the rest.
The relationship between the two disciplines isn’t an either/or situation, and it’s worth being precise about this. Your organic rankings are still the strongest single path into Google’s own AI interfaces, because AI Overviews and AI Mode are based on the index you’re already working toward. But they say almost nothing about whether ChatGPT mentions you, and ChatGPT accounts for the majority of usage in Denmark, as Section 12 shows. So, good SEO work gets you one half of the field for free and the other half not at all.
”You can rank number 1 on Google and still be invisible in ChatGPT. Ranking and visibility are two different things.”
The work is changing in four specific areas. These correspond to the layers in Section 09, from an SEO perspective.
Understand what questions your customers ask and at what stage they ask them. The better you understand the intent behind the question, the more accurately the page can answer it, and the easier it will be for a model to point to you when the question comes up again in a different wording.
The difference: Traditional SEO relies on keywords. Here, you work with questions across their entire range of variations, because the models interpret ”how much does an interim CFO cost,” ”price of an interim CFO,” and ”interim CFO fee” as the same question. A keyword map has rows. A question catalog has topic clusters.
Onsite: Structured content that answers the question precisely. Offsite: Mentions and references in sources that the algorithms rank highly. Having one without the other results in either high-quality pages that no one links to, or mentions that point to a website that cannot answer the question.
The difference: In traditional SEO, offsite work involves links. In AI models, it involves mentions, with or without links. The correlation data from Ahrefs in Section 06 suggests that the number of mentions of the brand name is more strongly correlated with visibility in AI Overviews than the number of backlinks. This shifts the focus from traditional link building toward PR.
Organic rankings, search volume, and Search Console data show where your efforts yield the best results. The pages with high impressions and a low click-through rate address the topics you’re closest to dominating. Start there instead of building new content.
The difference: Volume and placement no longer determine prioritization on their own. A keyword that never triggers an AI response is a pure SEO keyword and should be treated as such. A keyword that almost always does trigger a response is an AI keyword, no matter how small the search volume. Check this for your most important keywords before finalizing your plan.
Measure both the rankings and the percentage of mentions in AI responses before the first page is optimized. Without a baseline, you cannot distinguish between an initiative that works and a fluctuation from one measurement to the next. Section 11 explains how large a fluctuation is required.
The difference: A ranking metric is stable enough that a single reading is meaningful. An AI response fluctuates too much for that. The baseline is therefore not a mere formality here, but the prerequisite for being able to interpret a result at all afterward.
Three Approaches to an AI Response
The terms “model,” “RAG,” and “assistant” are used interchangeably in most of the literature on the subject. The distinction is not merely academic: it explains why some work yields results in a month, while other work takes a year. The Model That's what she learned during training. RAG is the live search that fetches the latest pages while the response is being generated. The Assistant is the product the user sits in. We keep them separate throughout the entire process.
Your company or product name can appear in a response in three different ways. Each operates on its own timeline, and that’s where planning comes into play.
A language model is trained on large amounts of text from the internet, particularly from filtered web archives such as Common Crawl. In addition, cleaner sources such as Wikipedia, books, and established media outlets are weighted more heavily than their share of the text alone would warrant, because they are editorially reliable. The exact composition is not publicly available for newer models, so be skeptical of anyone who claims to know it in percentages.
Here’s the key point worth pausing to consider: Common Crawl cannot execute JavaScript. If a simple crawler can’t read your pages today, you won’t be included in the data used to train the next generation of models. The technical work in Section 07 is therefore not just about this week’s results, but about how the models will perceive you a year from now.
An outdated image that the model has learned won’t disappear just because you correct your website. It will remain until the next training cycle. However, you can change what it learns next time, and that’s determined by sources outside your own website. Section 10 explains how to correct them.
Note: The model's behavior is fine-tuned after training using human feedback, known as RLHF. This is a training step and not a data source, even though the two are often confused.
RAG (Retrieval-Augmented Generation) is the search the assistant performs while writing the answer. The assistants approach this differently. ChatGPT retrieves fresh pages through a combination of sources: OpenAI documents both its own index—which is populated by the OAI-SearchBot crawler—and third-party search providers, specifically naming Bing and Shopify. Metrics from the summer of 2026 also point to scraped Google results via third-party providers. OpenAI does not disclose how the sources are weighted. Gemini retrieves data from Google’s index, and Perplexity combines third-party searches with its own index. As a result, content that ranks highly in search results may end up in an AI response, even if it was never part of the training data.
This is the fastest of the three methods. If you edit a page and it is crawled again, the results can change within weeks. This is also where a measurement can confirm or refute a hypothesis within a single month.
On Google’s own platforms, ranking is a shortcut to Path 2, because AI Overviews and AI Mode draw from the index that your SEO efforts are already optimizing for. A strong ranking can therefore get you included in an answer, even if the model has never seen the page during its training. This is the bridge between traditional SEO and AI visibility—and the most tangible of the three paths to pursue. However, it does not apply to ChatGPT.
What makes a model trust a source?
Several factors come into play at once, but they do not carry equal weight. We have the strongest evidence for the first one, and the rest are listed in descending order based on how certain we are about them.
How often the source is cited elsewhere. It is the strongest single signal for which we have data, and this is documented in the box below.
Editorial quality and historical accuracy. Sources that are accurate over time are cited more often.
Current Events. A dated and well-maintained response is better than an undated one.
How easily the answer can be gleaned from the text. A page where the conclusion is stated explicitly is easier to cite than one where it must be inferred. These are the techniques described in section 08.
A pattern emerges. Ahrefs analyzed 75,000 brands in May 2025 and found that the frequency with which a brand name is mentioned online is significantly more strongly correlated with visibility in Google AI Overviews than the number of backlinks is, 0.66 vs. 0.22 in rank correlation. This is a correlation, not proof of causation, and the metric counts mentions anywhere on the web, not just outside your own domain. But the trend is clear enough to shift the balance: Being mentioned counts for more than being linked to.
Three things work, and two are sold as if they do
AI crawlers work differently than Googlebot, and this difference can cost you visibility if it’s overlooked. Three things make a difference: server-side rendering, access in robots.txt, and technical best practices regarding speed and mobile optimization. They’re listed below in order of impact, and each one includes a time estimate so you can see what’s a ten-minute task and what’s a development project. Finally, there’s structured data and llms.txt. They’re included because they’re marketed as solutions without actually being any.
The field is split in two. The crawlers originating from a search engine render JavaScript, and this is documented by the providers themselves: Googlebot runs the page in a headless Chromium, Bingbot in a continuously updated Edge engine, and Applebot also renders. Everything that Google, Copilot, and Apple’s interfaces respond to comes that way.
The crawlers built for AI do not do this. No provider documents a renderer for the GPTBot, OAI-SearchBot, ClaudeBot, Claude-SearchBot, PerplexityBot, CCBot, or Meta crawlers, and the largest available log analysis points in the same direction: Vercel and MERJ reviewed 569 million requests on their networks and found no evidence that scripts were executed. GPTBot fetched JavaScript files in 11.5% of its requests and ClaudeBot in 23.8%, without executing them.
If your website uses client-side rendering, half of the users will see an empty shell, and ChatGPT is the largest single player in that half.
Server-side rendering or static generation solves this problem. If the entire website needs to be rebuilt, it’s a major project, and very few can take it on at short notice. There are three less extensive approaches, listed in order of how sustainable they are:
Static generation of the most important templates. Service, product, and item pages are generated as finished HTML upon publication. This is the most robust solution, and it can be implemented template by template rather than all at once.
Server-side rendering on selected routes. Modern frameworks like Next.js, Nuxt, Remix, and SvelteKit can handle this on a per-route basis. This means you don’t have to convert the entire website just to make the twenty pages that matter accessible.
Pre-rendering before the crawlers. A middle layer serves pre-rendered HTML to crawlers and the standard app to users. It’s the fastest to set up and the least sustainable of the three, because it’s yet another system that needs to be maintained. Important caveat: The crawler must see the same content as the user. If you serve something different, that’s cloaking—and then the problem is bigger than the one you solved.
Action: Weeks, and that requires developers. It's the most expensive item on the list and, at the same time, the only one that's expensive.
Open one of your most important pages, select ”View Source” (not the Developer Tools panel), and search for a sentence from the body text. If the phrase appears in the source code, the crawlers can read it. If it appears only in the developer panel, it’s invisible to everyone except Google. Run this test on the pages you most want to be indexed before doing anything else.
The file controls which crawlers are allowed to crawl your pages, and the major AI crawlers respect it. If you block the ones you want to be found by, all your other efforts will be wasted. This happens more often than you might think, because the list is written once and then copied from website to website.
The distinction that really matters isn’t between AI crawlers and regular crawlers. It’s between those that crawl for training purposes and those that crawl so they can quote you in a response right now. With some providers, these two options can be selected separately. With others, they cannot.
| User agent | Who | If you block it, you'll lose |
|---|---|---|
| OAI-SearchBot | OpenAI | Visibility in ChatGPT's search results. OpenAI states this explicitly |
| ChatGPT User | OpenAI | Page load when a user asks ChatGPT to open a page. Does not affect search visibility |
| Claude-SearchBot | Anthropic | Indexing for Claude's search results |
| Claude-User | Anthropic | Visibility when a Claude user searches the web |
| PerplexityBot | Perplexity | Visibility in Perplexity's response. It is not used for training. |
| Googlebot | Google Search, AI Overviews, and AI Mode All at Once | |
| bingbot | Microsoft | Bing and Copilot at the Same Time |
| Applebot | Apple | Siri, Spotlight, and Apple's AI responses |
| User agent | Who | What You Lose by Blocking |
|---|---|---|
| GPTBot | OpenAI | Training future models—nothing else |
| ClaudeBot | Anthropic | Training, nothing else |
| CCBot | Common Crawl | Future Common Crawl datasets, which in turn will be used to train many other models |
| Applebot-Extended | Apple | Training Apple's models. It doesn't crawl on its own |
There are three places where you can't take things apart
Google Extended is misunderstood more often than anything else in the file. It is not a crawler and does not have its own user agent, but rather a control token. It controls whether content that Googlebot has already fetched may be used to train Gemini and to support responses in Gemini apps and Vertex. If you block it, you’ll lose not only the training data but also the space in Gemini’s responses. On the other hand, it won’t affect your rankings or AI Overviews.
AI Overviews and AI Mode are controlled solely by Googlebot. There is no line in robots.txt that allows you to remain in Google Search while being excluded from AI Overviews. In June 2026, Google began testing a control in Search Console that can do just that, but so far it has only been rolled out to a portion of UK websites and is not yet mentioned in Google’s own documentation. Until it reaches Denmark, the “preview” controls “nosnippet” and “max-snippet” are your only options, and they also trim your regular search snippets.
At bingbot and meta-externalagent One token serves two purposes. Bingbot feeds both the Bing index and Copilot, and Meta's token covers both training and product indexing. If you want to opt out of one, the other comes along with it.
Source for the column on what you lose: The providers” own documentation, checked on August 15, 2026. OpenAI states regarding OAI-SearchBot that excluded websites ”will not be shown in ChatGPT search answers,” and regarding ChatGPT-User that it is ”not used to determine whether content may appear in Search.” Anthropic states that blocking Claude‑User ”may reduce your site’s visibility for user‑directed web search.” Perplexity states that PerplexityBot ”is not used to crawl content for AI foundation models.” Google states that Google-Extended ”does not impact a site’s inclusion in Google Search.” Apple states that ”Applebot-Extended does not crawl webpages.”.
Note: The robots.txt file is optional for crawlers that retrieve content because a user has requested it. Perplexity-User and Metas’ meta-externalfetcher state themselves that they can ignore the file. If something needs to be excluded with certainty, it must be done on the server and not in robots.txt.
Action: Ten minutes for anyone who can edit robots.txt. It's the cheapest item on the list—and the one that's most often set up incorrectly.
Fast loading times and a usable mobile experience benefit users, search engines, and crawlers all at once, and Core Web Vitals set the threshold for ”good” at an LCP of less than 2.5 seconds on mobile. But let’s be clear: This alone won’t move your ranking in an AI result. It ensures that the rest of the content gets read, and it’s part of day-to-day operations, not part of the optimization strategy.
Action: Ongoing, shared between the developer and the web manager.
Two things you can leave out
Ahrefs tracked 1,885 pages that added JSON-LD between August 2025 and March 2026 and compared them to 4,000 control pages with the same citation level prior to the change. The result was +2.41 TP4T in AI Mode and +2.21 TP4T in ChatGPT—both too small to be statistically significant—and a decrease of 4.61 TP4T in AI Overviews, which they themselves cannot explain. A separate test by SearchVIU showed that five AI systems, which fetched pages in real time, ignored JSON-LD, Microdata, and RDFa and extracted only the visible HTML. Google states in its own documentation that structured data is not required for the generative features. Keep it for rich results in classic search and to link your identity across sources using `sameAs`. Don’t count on it as a source for citations. An important caveat: The pages in the study had all been cited 100 times or more beforehand, so this says nothing about pages the models do not yet know.
Ahrefs analyzed 137,210 domains in June 2026. 97% of the valid llms.txt files received no queries in May of that year. Among the few that received traffic, SEO tools that checked for the file’s existence accounted for the largest share, while AI assistants accounted for 2.5%. AI crawlers never queried for the file on domains where it was not present. Google states that Search ignores it. The file takes an hour to generate and does no harm. It simply does not improve visibility, and it should not be included in a list of recommended actions.
The time you save on those two is better spent on the techniques in Section 08. There, the benefits are documented, and they are immediately apparent to the reader.
The technical work is an advantage for early adopters. In our reviews, many Danish websites have not yet addressed how a crawler without JavaScript reads their content. Add to that the fact that this same foundation determines whether you’ll be included in the next generation of training data, as described in Path 1 in Section 06, and there’s a real head start to be gained by getting this in place now.
Written for people, designed so the answer can be extracted
Google is explicit in stating that there’s no need to write in a specific way for generative features. What determines whether a page is used is whether it contains an answer that stands on its own. Four strategies make all the difference, and all four are visible to the reader.
A quotable conclusion is a statement that holds true even when taken out of context. State it explicitly immediately below the heading, rather than leaving it implied in the body of the text.
Our own specifications, which we follow: A standalone answer block of 40 to 80 words, placed immediately after the main heading, which contains a number, a qualification, and a “who.” If it’s fewer than 40 words, the answer becomes an unsubstantiated claim. If it’s more than 80 words, it can no longer be presented as a single block.
Test it by cutting out the sentence and reading it to yourself. If it's missing a number, a qualifier, or a "who," it's not complete.
Each prioritized question must have a page that answers it. The headline is the question as phrased by the customer, and the answer appears at the top. The models treat variations of the same question as a single question, so a gap in coverage is an opportunity for the competitor who has the answer.
What’s included in an answer are elements to draw upon: definitions, numbers, comparisons, procedures, and prices. Length isn’t the point. It’s the substance of the sentences that matters. A superficial treatment of a topic that others cover in depth rarely makes much of an impact.
Timeliness is one of the factors the models consider when evaluating a source. Include a visible date on the page, update it when the content actually changes, and avoid changing the date without modifying the text. A page that hasn’t been updated in three years is the best source there is for an outdated claim about you. It’s also the least expensive of the four strategies—and the one most often forgotten once the page has been published.
The point is implied, buried in the middle of a long body of text with no clear conclusion. In ”How Much Does an Interim CFO Cost?”, the answer isn’t stated directly anywhere. The model has to guess it itself, and it relies on another source.
The page opens with the question and immediately answers it in a standalone statement: ”An interim CFO typically costs X to Y DKK per month, depending on the scope and duration of the assignment.” The model can extract this information without losing meaning. The numbers are your own. The point is that they’re included in the sentence.
The question-and-answer format closely resembles the way people ask an assistant questions, and that alone is reason enough to use it. Google removed FAQ rich results from search results on May 7, 2026; reporting for them disappeared from Search Console in June; and support for them in the Search Console API ended in August. The FAQPage markup can remain in place without causing any harm, but Google no longer generates a rich result from it. The value lies in the visible text.
A 2026 study examined the types of content cited in AI responses and found that ranked ”Top X” lists were the single largest category, accounting for approximately 36% of the content citations. Among sources outside the companies’ own websites, videos, industry media, forums, and reference works accounted for the largest share.
This figure should be viewed with caution. The study is a preprint; it has not been peer-reviewed by independent researchers; it was written by a provider of GEO tools; and the sample is not representative.
This trend, however, is worth acting on, and it’s uncomfortable for most content strategies: The page that brings you to a solution is rarely your own service page. It’s the page that compares the options—even when one of those options isn’t you. If you don’t write it, a competitor or an industry publication will, and then it’s their page that the model cites when your customer asks.
You don't start over
If you’ve taken SEO seriously, you already have most of the foundation in place. Indexed pages, a backlink profile, years of data in Search Console, coverage in industry media, and listings: It all counts. Two things are truly new. One is a catalog of the questions your customers actually ask—not a list of keywords. This is also the set of prompts that the measurement tool will later run on. The other is a metric that tracks whether you’re being mentioned. The rest is work you’re familiar with, applied in a new context.
Research from Princeton and several other universities, presented at KDD 2024 and based on 10,000 queries, shows that techniques such as citing sources and adding statistics can boost a page’s visibility in AI responses by up to 40%. This is the maximum value measured using models available at the time. Use it as a guide to what works, not as a figure you can promise anyone.
A 2026 study measured how often brands are mentioned at all in AI responses to unbranded category questions. Global Tier 1 brands appeared in about 73% of the responses, Tier 2 brands in about 44%, and niche brands in about 11%—a difference of approximately 30 percentage points per tier.
The caveats are the same as for the previous figure: Once again, this is a preprint from a provider of GEO tools, without independent verification and based on a sample that is not representative. The figures indicate a trend, not a benchmark against which you can measure yourself.
This trend is worth taking seriously, as it sets a limit on what the five layers can achieve. Brand strength in the category is the single most important factor in determining whether you’ll be mentioned. Technical readiness and high-quality content pages are necessary, but they are not sufficient, and no provider can elevate a niche brand to compete alongside a global player in a broad category.
The conclusion is not to refrain from doing so, but to choose the category carefully. Broadly defined, you are Tier 3. Narrowed down to what you’re actually among the few to deliver, you’re Tier 1. You make that choice in Layer 2 below, and it’s the most important decision you’ll make throughout this entire process. More caveats of this kind are found in Section 13.
The model’s picture of you must be accurate and complete. A model gathers information about you from many sources across languages and domains, and if the picture is incomplete or contradictory, it will be difficult to recommend you. The diagnosis is simple: Ask a model what it knows about you, and note what is incorrect. The solution is described in Section 10.
Action: It takes half a day to make the diagnosis, but weeks to correct it. Start here, because the other four layers depend on the model knowing who you are.
You need to know what your customers are asking about, and that information isn’t found in a keyword list. A question catalog is based on purchase data and covers, for each clearly defined service, all the ways in which the same need is expressed. You’ll find them in sales and customer service conversations and in Search Console, where high impressions and low click-through rates reveal the questions you’re already close to dominating.
Action: Two to three days of marketing and sales at the same table. The catalog also serves as the data set on which the analysis in Section 11 is based, so build it once and use it in two places.
Each priority question requires one page that can be cited. The guidelines are in section 08. Test the page by asking a model: ”Can this be cited as the answer to the question?” If the model hesitates, you’ll know where to tighten up the text.
Action: Ongoing, one page at a time. This is the task that takes up the most space in the calendar, and the only one that can be scaled up with more people.
The models prefer to reference sources they trust, and the correlation from Ahrefs indicates that mentions of the brand name are the signal most strongly linked to the visibility of everything we have data on. That’s why this layer focuses on trade media, industry databases, reference works, and documented results. It is the slowest of the five layers. That’s why it appears early in the timeline in Section 14, even though it is shown last.
Action: Ongoing. With a budget for link building and citation work, the pace can be significantly increased.
The final layer is your share of mentions, calculated by category and by assistant, compared to a baseline and a fixed set of competitors, and tracked month by month. Without the fifth layer, the first four are meaningless: You can see that something is changing, but you can’t tell whether it’s the result of your efforts or just noise. The method and precision are explained in the next section.
Action: One day to set it up, then a regular monthly schedule.
If you ask, ”What do you know about us?”, the model gives a vague answer, confuses you with others, or cites outdated facts. It doesn’t know your services, segments, or geographic areas precisely and therefore doesn’t place you on a list.
The model can say without hesitation what you do, for whom, and where; it accurately describes your core services and draws on several independent sources that confirm the same picture.
There is no button, but there are three ways
The models make mistakes about companies, and those mistakes are rarely detected. No customer calls to say that an assistant said something wrong about you. That’s the part of AI work that’s most often diagnosed but never addressed.
There is no reliable general measure of how often this happens. The figures circulating in the industry are typically based on a handful of brands in a single sector, often measured by a single assistant, and therefore cannot be used to say anything about you. That doesn’t make the problem any less serious. It just means that you’ll have to measure it yourself, and that no one can tell you in advance exactly how bad the situation is for you specifically.
Find the errors systematically, not randomly
Most people discover an error by chance, fix one thing, and never hear about the rest. Instead, run the same set of questions through ChatGPT, Gemini, and Copilot, and write down each answer verbatim along with the date, assistant, and prompt. Seven types of questions cover the most common issues:
Seven questions for three assistants equal twenty-one answers and half an hour of work. That’s the baseline error rate, and it needs to be run again once the corrections have had time to take effect. Without it, you won’t know if anything improved.
The error is located in one of three layers, and each layer must be handled in its own way. If source references appear in the response, that is almost always where the error originates.
First, correct the canonical wording on your own page: What you do, for whom, where, and since when—all in a single, quotable sentence. Ensure consistent naming across pages and languages, and maintain a dated news or change log so there’s a clear indication of what’s currently accurate.
Wikidata is the fastest place to correct structured facts. The barrier to entry is low, and the entry is propagated into the knowledge graphs that the assistants rely on. Wikipedia is more cumbersome: You’re not allowed to edit your own article, but you can request corrections on the talk page while disclosing a conflict of interest—and that typically takes months. Add to that industry registries, reference works, and third-party profiles that carry more weight than your own website. Link them together using `sameAs` references so they’re recognized as a single identity rather than five separate mentions.
Once the error has been learned, it won’t disappear just because the sources are corrected. It will linger until the next training round. What you can do is make sure that RAG finds the correct answer every time, and that the incorrect version becomes harder to find than the correct one.
A model that lacks information about you will provide only a superficial response. A model that confuses you with another company actively attributes someone else’s story to you: their services, their ownership, their negative press coverage. This is the type of error that costs the most, and it particularly affects companies with a common name, a namesake in another country, or a former version of themselves following a divestiture or name change.
This approach is different from the others. Here, it’s not enough to say who you are; you also need to clarify who you are not. State the difference explicitly on your own page, and use your full legal name alongside the name people call you. If there’s someone with the same name, mention them. It feels wrong to mention a different company on your own website, but that’s exactly the phrase a model needs to set yourself apart.
What Formal Channels Can and Cannot Do
In August 2026, we reviewed the official channels of OpenAI, Google, Anthropic, Microsoft, Perplexity, and Meta. The picture is the same across the board: There is no channel called ”correct this information about my business.” It’s all about removing or restricting content, not correcting it.
Only two providers have a form that mentions businesses at all, and both are designed to address defamation. Google’s legal report form explicitly covers AI Overviews and AI Mode and includes fields for company name and the organization you represent. Meta has a similar form. Neither of them promises a specific outcome: Google states directly that submitting a report is no guarantee that anything will happen.
”Thumbs down” is not a review. The ”Not Factually Correct” button under an AI Overview provides neither a case number nor a response, and Google itself states that a product report does not replace a legal complaint. Microsoft is even more inconsistent: Bing Search accepts reports of defamation, while Copilot has only one category, and that one deals with copyright.
The right to correction applies to the individual, not the company. The GDPR’s rule regarding the correction of inaccurate information applies to personal data about an individual. If the inaccurate claim concerns your CEO, she can demand that it be corrected. If the claim is about the company—for example, a fabricated lawsuit or an incorrect financial figure—it falls outside the scope of the provision. This surprises most people, and it means that the process often involves an identified individual rather than the company itself.
If you own the domain, you can also ask Anthropic to block a URL from Claude's web responses. But that just removes it; it doesn't correct it.
If a claim is serious enough to be a legal issue, consult a lawyer before using these channels. For everything else, the three steps outlined above are the only way that works.
Corrections made through RAG can take effect within weeks. Corrections that require changes to the sources—and subsequent retraining of the models—take quarters. Measure it like anything else: Run the same queries that triggered the error at regular intervals and track the error rate, rather than asking once and hoping for the best.
The method, and how large a fluctuation is required
Share of Voice is your share of a defined field. In practice, you ask the same customer questions to the assistants that matter in your category at regular intervals, noting for each response which brands are mentioned and in what role—that is, as a recommendation, a reference, brief mention, or not at all—and then calculate your share of the mentions that the competitor set shares among themselves.
Two things follow from this definition, and they are more often overlooked than understood. The number depends on who you put in the field: If you add a top player, your own share decreases, even though nothing has actually changed. And the shares add up to 100% across the set, so a decrease for you is always an increase for someone else. That’s why the competitor set is locked before the first measurement is taken, and if it’s changed later, you can’t compare it retroactively.
A single response tells us almost nothing. A variance study analyzed 12,933 responses about brands and found that rerunning the same prompt accounted for 34.8% of the variation, the interaction between brand and context accounted for 29.6%, and the language of the prompt accounted for 26.5%. The brand itself—that is, what you’re trying to measure—accounted for 1.5%. The signal constitutes a fraction of each individual response. Therefore, the sample must be designed, not estimated.
Our standard per category
The metrics are kept separate. A combined figure obscures precisely the differences that need to be tracked. Mentions and source citations are also tallied separately because they answer two different questions: whether you are mentioned, and whether your page is used. Multiple phrasings of the same question provide greater precision than multiple repetitions of the same phrasing, because three phrasings draw from three different clusters of questions. And a prompt set consisting predominantly of ”what is” questions yields a nice number but no commercial value.
Two Ways to Buy Insurance, and How Much Each One Costs
The noise in a single response can be addressed in two ways, each of which answers a different question.
Run the same prompt 20 to 30 times until the pattern stops shifting. This gives you an accurate level right now, and that’s the approach you should take when you need to establish a number—for example, a baseline or a reporting figure that needs to hold steady.
Run a fixed set of prompts at regular intervals and analyze the trend rather than a single data point. That's what shows the direction and reveals whether a competitor is about to overtake you.
The two are not mutually exclusive, and a proper measurement uses both, though not in equal measure: The many repetitions are part of the baseline and the reporting that a number must be able to support, while the ongoing cadence can run with fewer runs because it’s meant to show a direction rather than a level. This difference matters when it comes to what you can conclude. A curve tells you whether you’re moving. It doesn’t tell you that you’re exactly at 22% this week.
How big of a fluctuation do you need to see before it matters?
With a 95% confidence level and a mention frequency of approximately 20%, the uncertainty in the measurement is as follows:
| Responses by assistant | Uncertainty | What this is equivalent to |
|---|---|---|
| 50 | ±11.1 percentage points | 50 prompts, one run |
| 100 | ±7.8 percentage points | 50 prompts, two runs |
| 150 | ±6.4 percentage points | 50 prompts, three runs |
| 500 | ±3.5 percentage points | 50 prompts, 10 runs |
| 1.000 | ±2.5 percentage points | 50 prompts, twenty runs |
Binomial uncertainty at a mention frequency of 20%. Precision improves with the square root of the number of responses, so halving the uncertainty requires four times as many responses.
The table explains why 20 to 30 runs are the standard when determining a level. With 50 prompts and 20 runs, you’ll have 1,000 responses per assistant and a margin of error of about 2.5 percentage points, and two measurements would need to differ by approximately 3.5 percentage points for the difference to be statistically significant.
If, instead, you run a fixed set of about 80 prompts once per measurement, the uncertainty at each individual point is around 9 percentage points. A single data point cannot, therefore, support a conclusion, but twenty consecutive data points can indicate a trend. A shift from 22% to 25% from one measurement to the next means nothing. That is why we report the trend line rather than the figure from the last run, and it is the most common reason why AI reporting is overinterpreted in both directions.
Here is the breakdown
| Actor | Share of Voice | Average position | Mentioned in |
|---|---|---|---|
| Company A | 31% | 1,4 | 96 of 240 responses |
| Your brand | 22% | 1,9 | 68 of 240 responses |
| Company B | 18% | 2,3 | 56 of 240 responses |
| Company C | 11% | 2,8 | 34 of 240 responses |
| Other items in the set | 18% | 55 of 240 responses |
Simplified example. The figures are illustrative and do not come from a specific client. The percentages add up to 100% because Share of Voice is the share of the fixed set of competitors. The far-right column, on the other hand, counts responses and totals more than 240, because a single response typically mentions multiple names.
The table shows three things at once: what percentage of the field you account for, where you rank when you’re mentioned, and how often you’re mentioned at all. The last one is the one that changes first when your efforts start to pay off.
There are five more numbers worth keeping an eye on, and together they reveal whether the trend is due to you or to others:
Coverage per surface. In how many of the inquiries are you involved with each assistant? The difference between 77 out of 79 for one and 60 out of 79 for the other is a matter of priority, not a minor detail.
Average ranking per surface. Being ranked 1.6th on average is different from being ranked 2.5th, even if the percentage is the same.
Percentage of citations. How many of the sources that the models actually draw from in this category are your own pages?
Momentum. Who has gained and lost market share since the last survey? A decline for you that is offset by an increase for one specific competitor is a different story than a decline spread across all competitors.
The tone when your name is mentioned. Are you recommended, or are you simply mentioned? These two should be scored separately, because the tone varies much more often than the mention itself.
We rate the tone in four levels rather than two: negative, neutral, positive, and recommended. The difference between “positive” and “recommended” is not merely cosmetic. Being mentioned among others and being recommended are two different outcomes of the same query, and only one of them influences a purchasing decision.
The pattern we see consistently across more than 300 analyses over the past six months is that tone and visibility go hand in hand, and that this is most evident with ChatGPT. Brands that are mentioned positively or recommended are also the ones that appear most frequently. Brands with negative mentions in the sources struggle to be mentioned at all.
This is a correlation, not a cause. There is at least one obvious explanation that has nothing to do with the tone itself: Strong brands receive both positive coverage and a prominent place in the response, as discussed in section 09 regarding brand strength. For your work, it doesn’t matter what causes what. If there’s a negative issue in the sources the models draw on, it must be addressed first. New response pages and technical cleanup won’t change your visibility as long as the sources say something else about you.
There is no official benchmark. The fixed ranges circulating in industry blogs cannot be traced back to a published study with a defined methodology, so we do not use them. The trend, however, is predictable: The more concentrated the category, the larger the share captured by the leading brands, and in a fragmented market, even the category leader may account for far less than half of the responses. The number that matters is your own, measured against your own baseline and against the competitors the customer is choosing from.
In June 2026, Search Console introduced a report on generative AI performance that shows how content is performing in AI Overviews and AI Mode, with data going back to mid-May. It covers Google’s own platforms and no others, and it is measured at the source, whereas everything else in this section is based on samples. Use this as a reference point for Google’s data and the measurements for the rest. Google states in the same documentation that you should exercise caution with third-party tools that claim to use internal Google metrics. This also applies to our own tool: The dashboard measures responses from the assistants and has no access to Google’s ranking system. This is an important distinction, and you should ask for clarification if a provider is unclear about it.
What the survey reveals when you look at the sources
An example from a Danish B2B category we’re currently tracking: consulting services for housing associations, 79 inquiries, tracked since February. The source layer shows 1,314 cited sources spread across 392 domains, and the distribution does not look the way most people would expect:
Reddit accounts for 22.8% of all citations. Nearly one in four sources that the models draw on in this category is a forum thread.
The customer's own website accounts for 10.6%, In other words, second place.
A competitor's PDF brochure appears in 68 of the 79 inquiries. Not an article, not a service page. A brochure.
The rest is spread across industry portals, association media, Retsinformation, and a fair amount of noise.
Three things follow from this. First, authority building involves not only industry media but also the places where buyers interact without yet being customers. Second, a document is cited if it is relevant, regardless of whether it is a web page or a PDF. And third: Without the source layer in the measurement, the client would have spent the entire budget on its own website and never realized that nearly a quarter of the market was located somewhere else entirely.
The Secondary Effects
If you’re mentioned more often, it leads to a number of knock-on effects. Most of these can be seen in the metrics you already have access to, but they’re scattered across analytics, your ad account, and CRM, so they’re rarely viewed as a single picture. Two additional factors are also part of the AI measurement itself: The citations show which of your pages the models draw upon, and the response readiness metric shows how many of the category’s questions you have a page that can be cited for.
More brand and product searches, more direct traffic, and a higher click-through rate on your paid ads. A name that customers have seen recommended gets clicked more often.
Lower bounce rate. Visitors who come from a referral have landed on your site intentionally and have already determined that you are relevant.
More inquiries and conversions in this category, and a higher win rate, because you’re more often on the list from the start.
The effects do not occur simultaneously. Demand and traffic quality change first, while the win rate follows the sales cycle and therefore takes the longest to change. None of these figures can be attributed to AI alone, as they are also influenced by campaigns, seasonality, and price. That’s why we compare them to the Share of Voice curve to confirm that the curve has an effect independent of the AI responses.
Get an AI SEO Audit
A no-obligation audit shows how visible you are in AI responses today, which sources the models draw from in your category, and what’s preventing you from being mentioned.
Request an AI SEO AuditThe same page is perceived differently
The following are patterns derived from our own work combined with public traffic data. None of the providers disclose how they weight their sources, so use this to help set priorities rather than as a definitive answer. The distribution of usage, however, has been measured, and the Danish distribution differs from the global one.
Market share in Denmark, July 2026 (StatCounter, based on page views). Perplexity accounts for 3.0% and DeepSeek for 0.2%. For comparison, in Europe: ChatGPT 75.3%, Gemini 11.2%, Perplexity 4.8%, Copilot 4.7%, Claude 4.0%. The figures measure web usage and do not include usage within apps or in Microsoft 365.
Three things are worth noting from the Danish figures. ChatGPT has a stronger presence in Denmark than in Europe as a whole and significantly stronger than in the global picture, so for Danish B2B, this is the area that needs to be addressed first. Gemini, on the other hand, appears to have a small presence, though this is more of a measurement issue than a definitive conclusion: AI Overviews and AI Mode are integrated into Google Search and aren’t counted at all in chatbot statistics, so Google’s actual share of AI responses is far greater than the 8.7%. And Copilot is ahead of Claude in Denmark, whereas globally the situation is reversed.
The field is divided into two camps, and the dividing line runs somewhere other than where most people think. It’s not about who’s the best, but about who can even see your website.
View the rendered website: Google's pages, Microsoft Copilot, and Apple's pages. They are crawled by Googlebot, Bingbot, and Applebot, all of which run JavaScript.
I can only see the raw HTML: ChatGPT, Claude, and Perplexity. Their crawlers do not run JavaScript.
If your website is client-side rendered, you’ll be in one half of the field and not the other. And the half you’re missing out on is the one where four out of five Danish AI visits occur. That single difference in this section has a direct impact on your budget. The test is in section 07.
Places great emphasis on authority and favors research articles, academic literature, and established media outlets. The search layer is a combination in which OpenAI both documents its own index and names Bing and Shopify as third-party search providers; OpenAI does not disclose how it weights these sources. Superficial product pages rarely rank well here. This is also the area where we most clearly see the tone come through: Negative mentions in the sources coincide with the brand not being mentioned at all, while those that are positively mentioned and recommended are the ones that dominate. The mechanics are described in Section 11.
The handle: Server-side rendering, access for OAI-SearchBot, and coverage in established sources. Also, keep the website indexed in Bing, which OpenAI continues to list as a search provider. It’s a low-cost safeguard against the worst-case scenario.
It is powered by Googlebot and Google’s index, and much of the traditional SEO work carries over directly. If you have a solid foundation in Google, you have a head start in this area, and it’s the only one where a client-side rendered website can get away with it.
The handle: Classic SEO. The work you're already doing counts here.
Prioritizes authoritative sources and rewards content that covers a topic from multiple angles. In Denmark, it stands at 3.8%, which is slightly below Copilot. Relevant in technical and analysis-heavy categories; rarely decisive in terms of volume.
The handle: Depth over breadth. Pages that cover a topic thoroughly and from multiple angles, rather than many pages with superficial coverage.
Places greater emphasis on company databases and up-to-date content. Timeliness and an accurate, well-maintained company profile are more important here than on the other platforms. With a score of 3.0% in Denmark, it is the smallest of the five we’re discussing here, but in our experience, it is overrepresented among users who perform in-depth analysis, and these users often work in procurement and analytics roles.
The handle: Company profiles in registries and databases, and dated web pages that are actually kept up to date.
The segment most often overlooked in Danish B2B analyses is ahead of Claude here, with 3.9%. This figure underestimates the actual reach, as the product is virtually nonexistent on the open web: Microsoft reported over 30 million paid M365 Copilot seats as of the end of June 2026—a doubling in just half a year—and the product is embedded in Word, Outlook, and Teams at precisely the organizations that purchase B2B solutions. At the same time, let’s be realistic: Subscriptions do not equal usage, and where employees have access to both Copilot and ChatGPT, most choose ChatGPT in practice.
The handle: The Bing Index and Microsoft Graph. Bing visibility is the only way in.
Market data tells you where users are. It doesn’t tell you where your buyers are, and that’s what the metrics in Section 11 address. Until that is established, the starting point for a Danish B2B company is: ChatGPT first, because four out of five Danish visits to the assistants’ web interfaces land there. Next come Google’s platforms, because AI Overviews aren’t included in the chatbot statistics but still reach the buyer in the middle of a regular search.
Two factors affect that order, and both have to do with the category rather than the size. If you’re selling to Microsoft-heavy organizations, Copilot moves up because the product is open on their screens all day long. And if you’re selling to analytics, procurement, or research departments, Perplexity moves up despite the 3%, because users in those departments are skewed in your favor. The market share is an average across all Danes. You don’t sell to all Danes.
Six Situations, and How We Handle Them
AI visibility is a relatively new discipline, and part of what is marketed as a method consists of assumptions. There are six factors worth keeping in mind before anyone sets a goal. They don’t disappear along the way, so they’re just as much an ongoing discipline as they are a caveat at the outset.
The same prompt can yield different responses from day to day and from user to user. Only 1.5% of the variation is attributable to the brand itself—that is, what you’re actually trying to measure.
Here's how we handle it: We take the average of many measurements with a known margin of error and report the curve rather than the individual point. The calculation is given in Section 11.
No one knows the exact formula for determining which sources a model chooses. Anyone who claims otherwise is peddling a false sense of certainty that doesn't exist.
Here's how we handle it: We base our work on patterns, public documentation, and testing, and we document each time what has been measured and what is an assumption. Where we do not know, we state that we do not know.
A model may display incorrect or outdated information about your business, and no one will tell you. Neither you nor we know how often this happens to you until it’s measured.
Here's how we handle it: The standard round of seven question types for three assistants, run again after the corrections so that the error rate can be tracked. The procedure is described in section 10.
We can measure shifts in visibility, and we can see which pages are being cited. We can rarely distinguish the specific contributions of the entity, the response pages, and the mentions, because these elements operate simultaneously.
Here's how we handle it: We arrange the layers in a staggered order whenever practical, so that the sequence is at least clear. And when we cannot separate the effects, we note this—even in our own case studies.
Brand strength in the category appears to be the most important factor in determining whether you’re mentioned, as shown by the figures in section 09 and what we see in our own measurements. Technical readiness and well-designed landing pages are necessary, but they are not sufficient, and no provider can build up a niche brand to compete with a global player in a broad category.
Here's how we handle it: We choose the category before we choose the bet. The narrow category, where you’re actually among the few, beats the broad one, where you’re number thirty.
In the first half of 2026 alone, Google removed FAQ-rich results, launched a new report for generative AI in Search Console, began testing an opt-out control in the UK, and renamed several of its crawlers. Providers are changing names, rules, and interfaces faster than a method is typically revised.
Here's how we handle it: Key facts have a verification date and are reviewed again for each new assignment. A supplier who does not update its methodology is selling last year’s knowledge at full price.
That question always comes up eventually, and it deserves a proper answer. We don’t promise a specific Share of Voice, because the outcome depends on your starting point and your competitors—neither of which is within our control.
Instead, we can agree on what we actually control: how many of the questions in the category have a citable page, how many technical barriers have been removed, how many sources outside your website have been incorporated, and how quickly a detected error is corrected.
We track the percentage as a result, not as a promise. That’s the only fair way to break it down, and it has the advantage that both parties can see whether the work was completed, even in months when the curve didn’t move.
Order matters more than volume
Below is the sequence we follow ourselves, and who should be involved. You can complete the first two weeks without outside help, and they will determine whether the rest is necessary.
Run the source code test on your three most important pages. Review the robots.txt file for AI crawlers. Run your standard set of seven question types on ChatGPT, Gemini, and Copilot, and note both what’s incorrect and how you’re being talked about. If you find negative mentions in the sources the responses refer to, move that issue to the top of your priority list, because it will overshadow everything else.
Owner: Technical SEO or developer, half a day. Marketing, half a day.
Server-side rendering on the pages where the test failed. Correct the canonical description of the company, set up Wikidata, and link the profiles together.
Owner: Developer and Content Manager.
in parallel
Build the 50+ prompts from sales dialogs and Search Console, and lock in the competitor set. Run the baseline with enough iterations to ensure the level stabilizes—don’t stop after just one run. And at the same time, map out which sources the answers actually come from within the category. The latter is often the most surprising part, and it’s the prerequisite for ensuring that your authority-building efforts point in the right direction.
Owner: Marketing and Analysis.
One page per priority question, with the answer at the top. Start with the five questions where competitors account for the largest share of the baseline.
Owner: Content Manager.
in parallel
Launch PR and media outreach targeting the specific sources identified on the source map. This is the slowest phase, so it should start early.
Owner: PR or management.
and onward
Compare against the baseline, keeping the uncertainty in mind. Expect RAG to respond first, and that what the model itself has learned has not yet changed.
Owner: Marketing and analysis, then on a regular monthly basis.
After three to four months, the coverage should have shifted—that is, the number of questions in the category that you’re included in at all. After half a year, the percentage should start to catch up, provided the response rates hold steady. And what’s embedded in the models’ training only changes when they’re retrained, which none of us control. The authority layer is still the last to show up, and it’s also the one that lasts the longest once it’s there.
The models reflect the companies that are currently most prominent in the sources. That’s why the process starts with the diagnosis rather than the content: You can’t craft a solution if the crawler can’t read the page, and you can’t tell if something is working if there’s no baseline. Both steps take less than two weeks.
Get an AI SEO Audit
A no-obligation audit reveals three things: how visible you are in AI responses today, what’s holding you back, and what actions can be agreed upon. You’ll receive the sample size and margin of error so you can see for yourself how reliable the figure is. You’ll speak with the specialists who developed the methodology described in this document and who will be carrying out the work themselves.
We don't promise any specific numbers. We promise an honest starting point and a plan that can be followed through on.
If the decision needs to be approved by higher-ups, our Executive Brief The business case in just a few pages, tailored for the CMO and executive management, without getting into the technical details.
Documentation
All sources were verified on August 15, 2026. The sources are not all equally reliable, and readers should be able to tell this. The first nine are the ones on which the paper’s claims are based, and they include details on population, methodology, and limitations so you can assess for yourself how far they hold up. One of them is peer-reviewed (Aggarwal et al.), several are studies conducted by tool providers with published methodologies (Ahrefs, Vercel, Cloudflare), and two are industry studies from companies that market the very metrics they measure (Ranqo and Semrush). The rest are references: official statistics, the providers’ own documentation, and individual figures that are easy to verify at the source.
Primary sources
Other Sources and Documentation
The authors of the method

Has been working with search engine optimization since 1997 and founded InboundCPH in 2013. Advises companies in Denmark and internationally on visibility in search engines and AI assistants, and is the creator of the method described in this document. I have followed the field through three major shifts: from directories to algorithmic search, from keywords to intent, and now to three to five names in a single result.

Ian works with AI, marketing, and business development and has more than 25 years of experience in digital strategy. As Founder & COO, he drives InboundCPH’s technological direction and advises on how to translate AI into concrete decisions in marketing and business. His perspective shapes the document’s focus on how AI visibility becomes part of the overall marketing effort.

I’ve been working with SEO for 25 years and programming for more than 35. I’m a full-stack developer with ten years of experience in AI, and I’m responsible for the technical aspects of AI visibility—from rendering and crawl access to the changes that need to be made when tests fail. The requirements in Section 07 are based on that work.
InboundCPH A/S has been a specialized marketing agency since 2013 and works with companies in Denmark and internationally on SEO, AI visibility, paid search, and analytics.
If you have any questions about the method or any of the figures, please feel free to contact us. We’re happy to explain how we arrived at the results—even when the answer is that we don’t know.
© InboundCPH A/S, September 2026. The content is protected by copyright and may not be copied, distributed, or reproduced without written permission.